Juan R.
Pardo-Carrion
Main Results
Side-by-side comparison of
Fourier Transform Spectroscopy and
as calibration tools for ground-based
millimeter and submillimeter astronomy
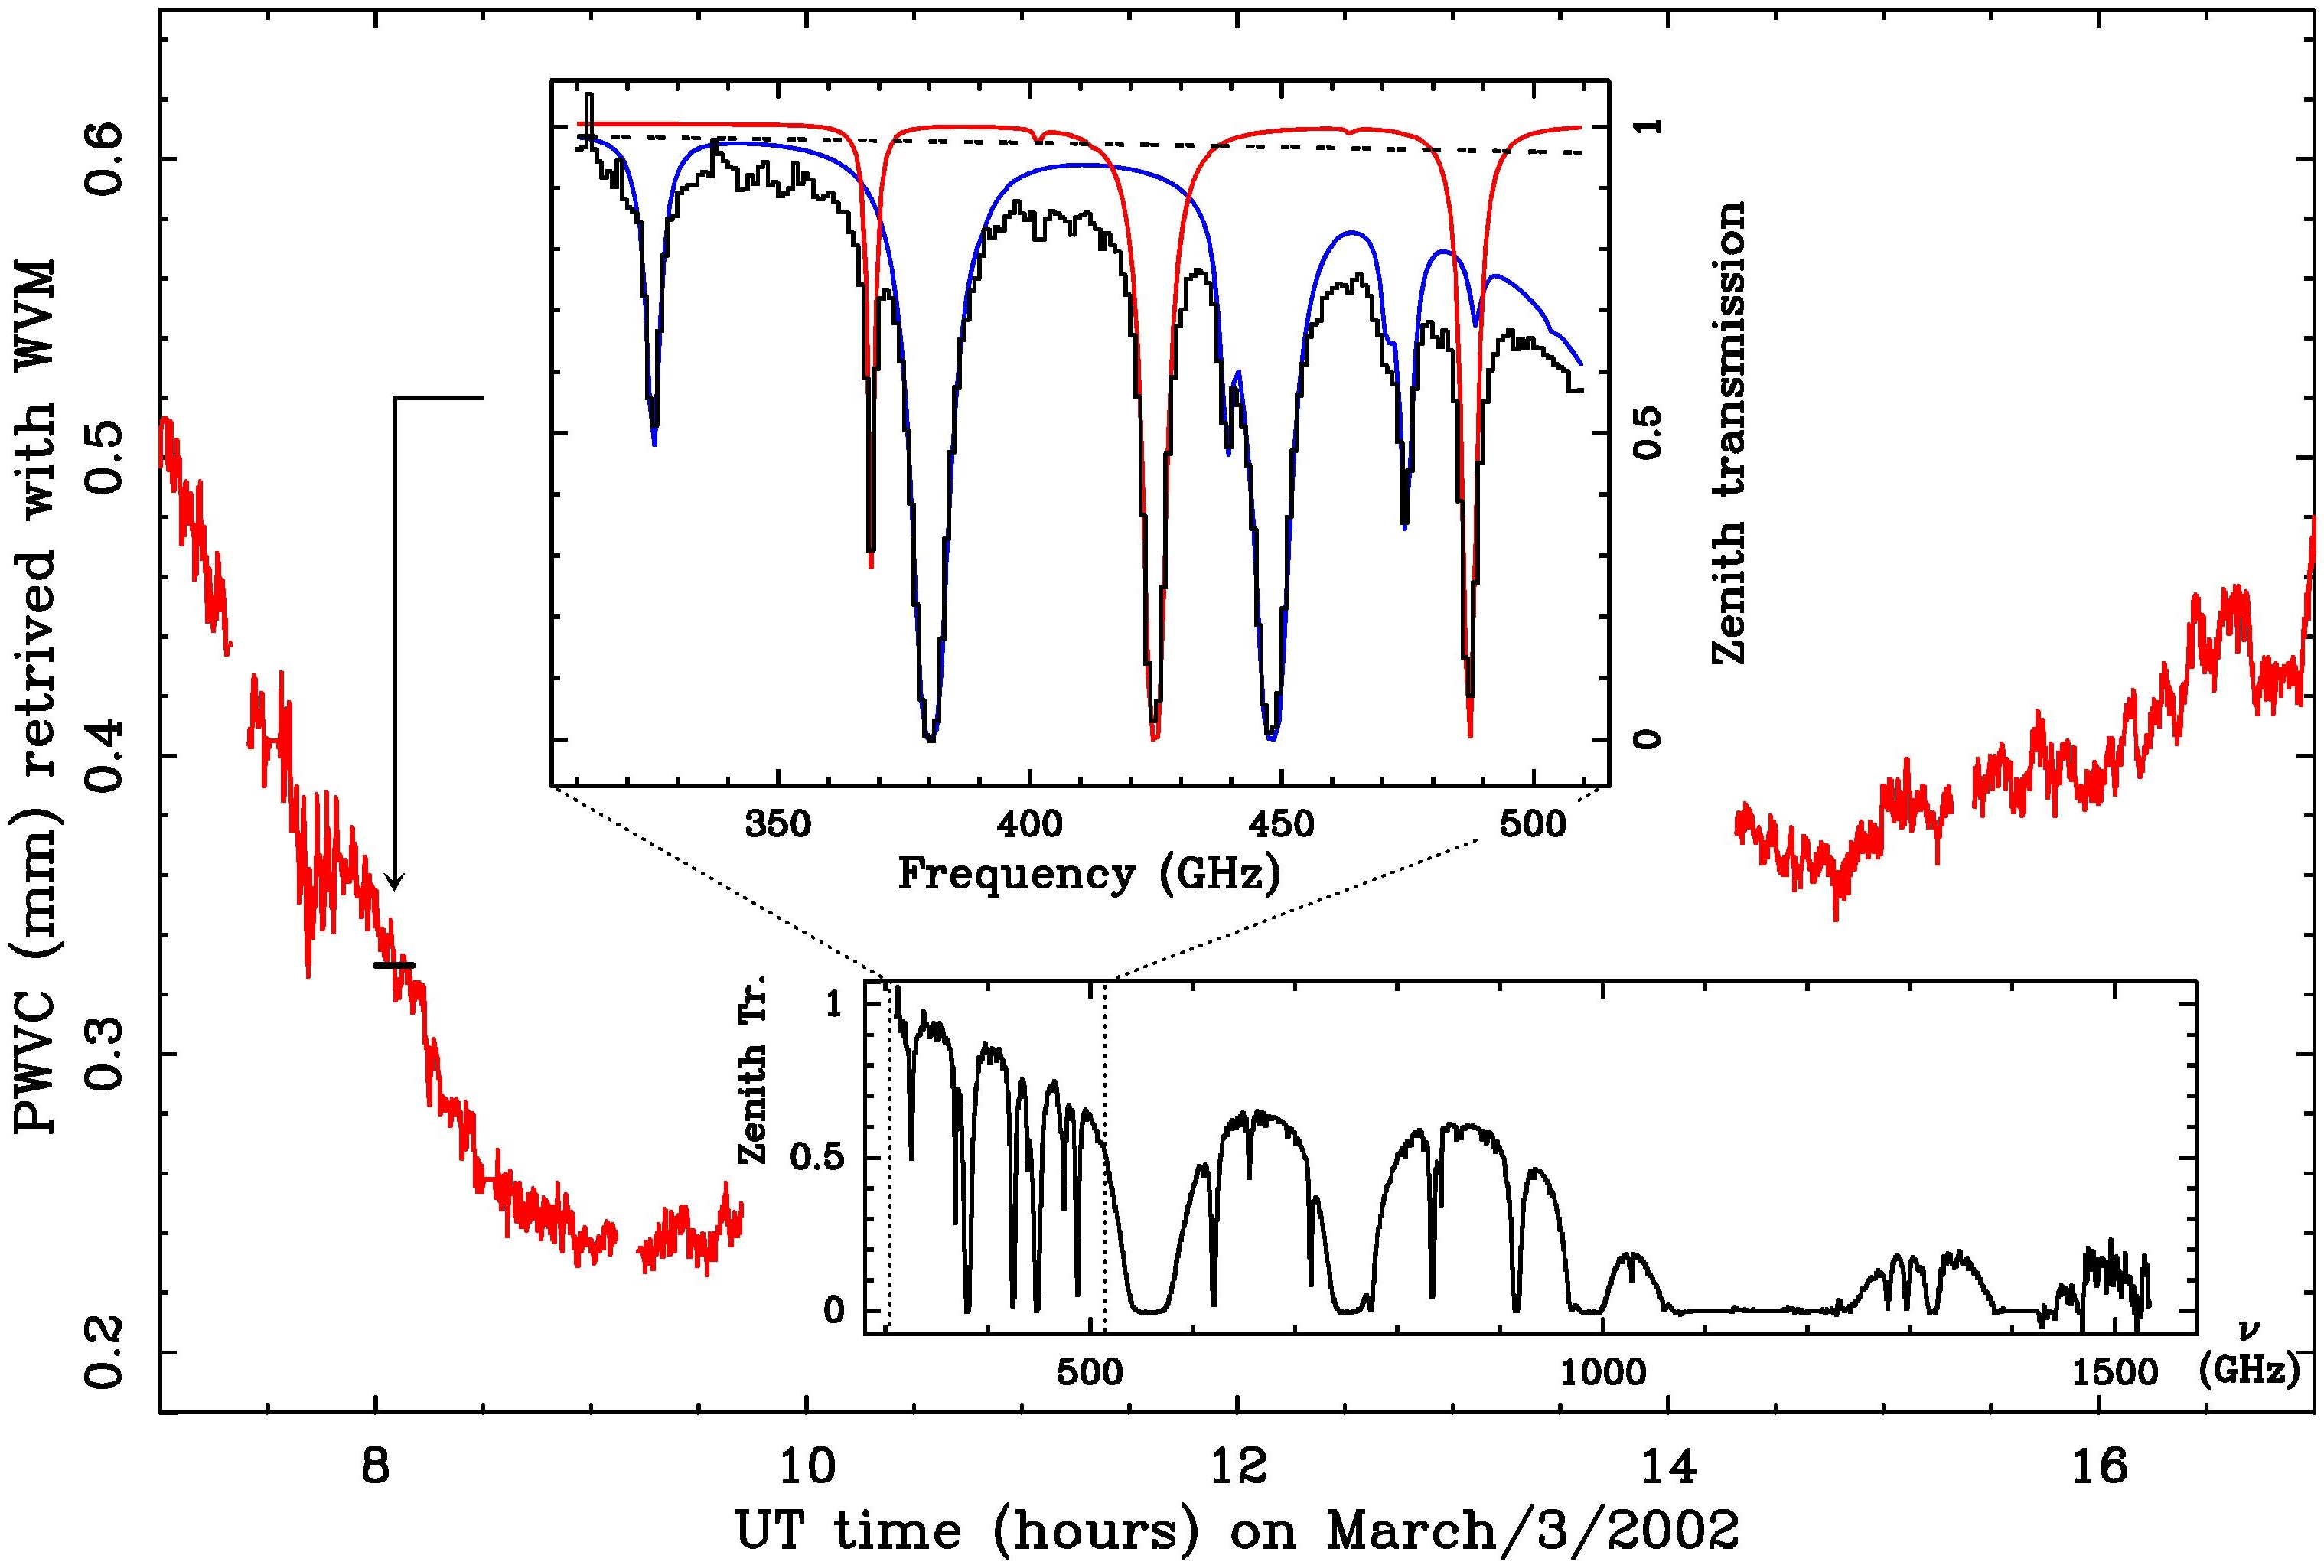
Measurement techniques to monitor the atmospheric transmission at millimeter and submillimeter wavelengths are necessary for the operation of instruments such as the Atacama Large Millimeter Array (ALMA). Our previous Fourier Transform Spectroscopy (FTS) work at the Caltech Submillimeter Observatory (CSO) has shown that the atmospheric transmission spectrum can be accurately measured by this technique up to ~ 1100 GHz with a time resolution of a few minutes. An alternative technique is Water Vapor Radiometry, generally using a few channels around the 183 GHz H2O line that can provide much finer time resolution but relies upon models to translate the derived water vapor columns into spectrum predictions over the required frequency ranges. Time resolutions of the order of one second are necessary to carry out phase correction in ground-based mm/submm interferometry, that can easily be reached by water vapor radiometers but not by FTS. Water Vapor Radiometry has the added advantages of being easier to operate and having lower costs than an FTS. In this context, we initiated a comparison campaign between the CSO FTS on Mauna Kea and a 3-channel 183 GHz water vapor monitor (WVM) mounted on one of the antennas of the Sub-Millimeter Array (SMA), some 250 meters away. The data presented here were taken on March 3, 2002, under very dry conditions (total precipitable water vapor zenith column, PWV, below 0.35 mm). The Atmospheric Transmission at Microwaves (ATM) model described in a previous paper has been used to analyze the data. The primary conclusion is that for weather conditions allowing ground-based submillimeter interferometry to be carried out the PWV can be measured with an agreement of about 0.01 mm between both instruments in time scales of several minutes, and therefore a combination of WVM plus an accurate mm/submm atmospheric model (based on extensive FTS work) provides a suitable tool for ALMA calibration in those conditions.
You can get more information about this work by downloading paper 34 from my publications list.