Juan R.
Pardo-Carrion
Main Results
11 years monitoring
of SiO maser sources
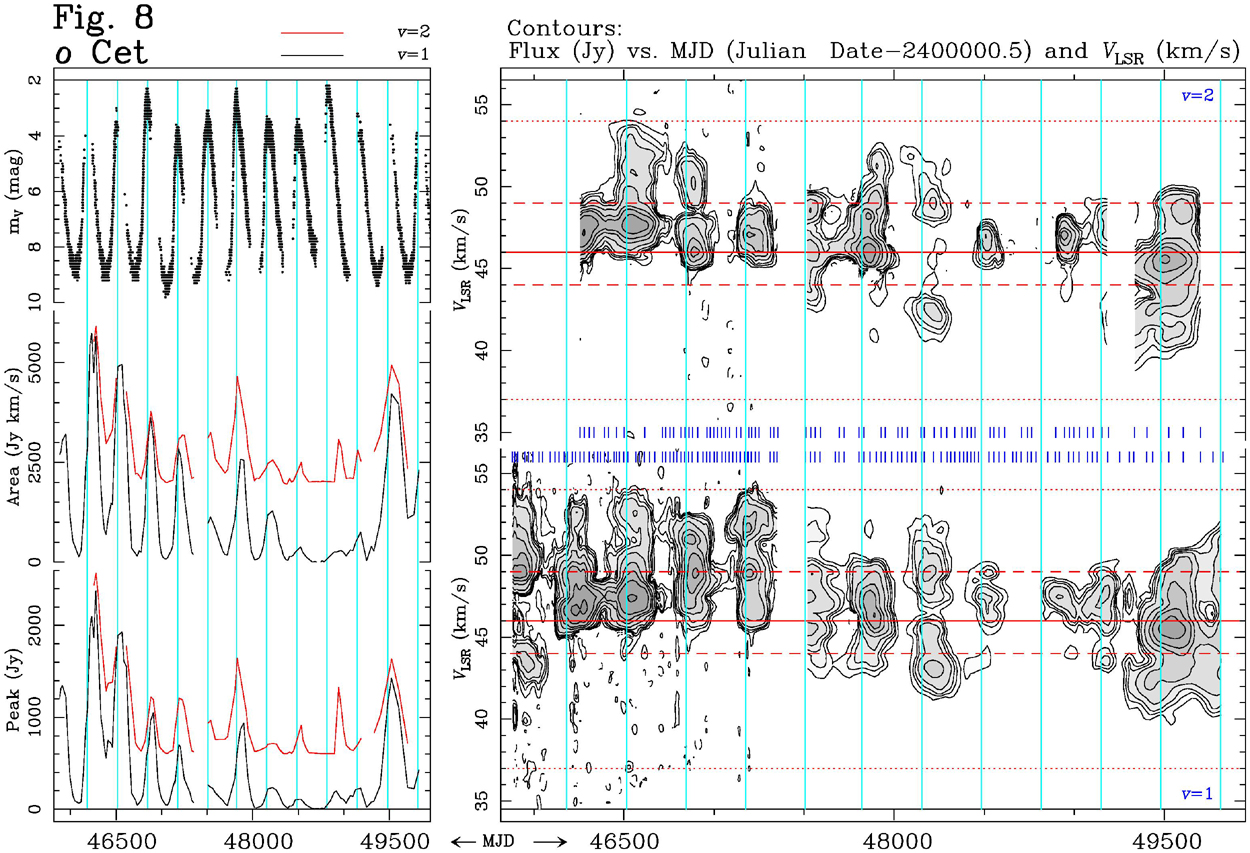
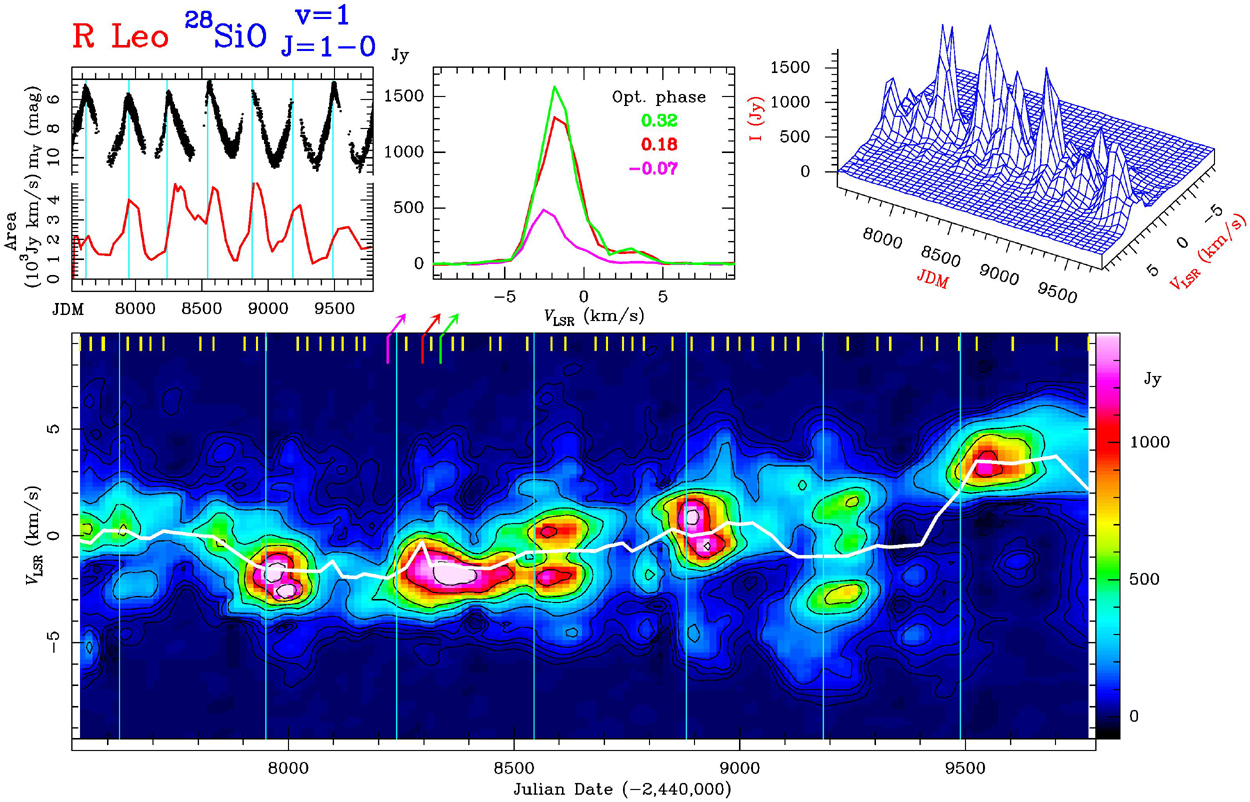
A long-term and short-spaced monitoring of 21 SiO maser sources, mostly evolved stars, has been carried out in two SiO maser lines at 43 GHz with the Observatorio Astron\'omico Nacional 13.7 meter telescope at the Centro Astronomico de Yebes (Guadalajara, Spain). The availability of optical light curves from the AAVSO for most of the objects during the whole period of the SiO monitoring, ground-based near-IR data for four sources overlapping with 3 to 5 observed SiO periods, and DIRBE near-IR data covering a significant portion of an SiO period in 10 sources, make this data set a unique reference for comparing optical, NIR and SiO variability in order to elucidate the physical mechanisms that pump SiO masers in evolved stars. A numerical time series analysis of the suitable SiO, optical and NIR light curves in regular variables has been performed to obtain precise values of the periods and phase lags between the different curves: There is evidence that in regular variable evolved stars the three types of emission have the same period and that the SiO maxima happen in phase with NIR maxima and with a phase lag typically between 0.05 and 0.20 with respect to optical maxima. Therefore, we conclude that in these objects the observational evidence presented in this work favors the radiative pumping of SiO masers against the collisional pumping.
You can get more information about this work by downloading paper 35 from my publications list.